Sign in to Guacamole
Guacamole displays a CAE Linux desktop in your browser. The tools run on the CAE machine. Use your own UW NetID and confirm that your account can reach CAE Linux services before the lab.
- On your laptop, open https://guacamole.cae.wisc.edu in a browser.
- Complete the UW web sign-in with your NetID and password, then complete MFA if requested.
- At the Linux login screen, enter your UW NetID and password again. Use your NetID credentials at this second prompt too. The old separate CAE username and password are not the instructions for this service.
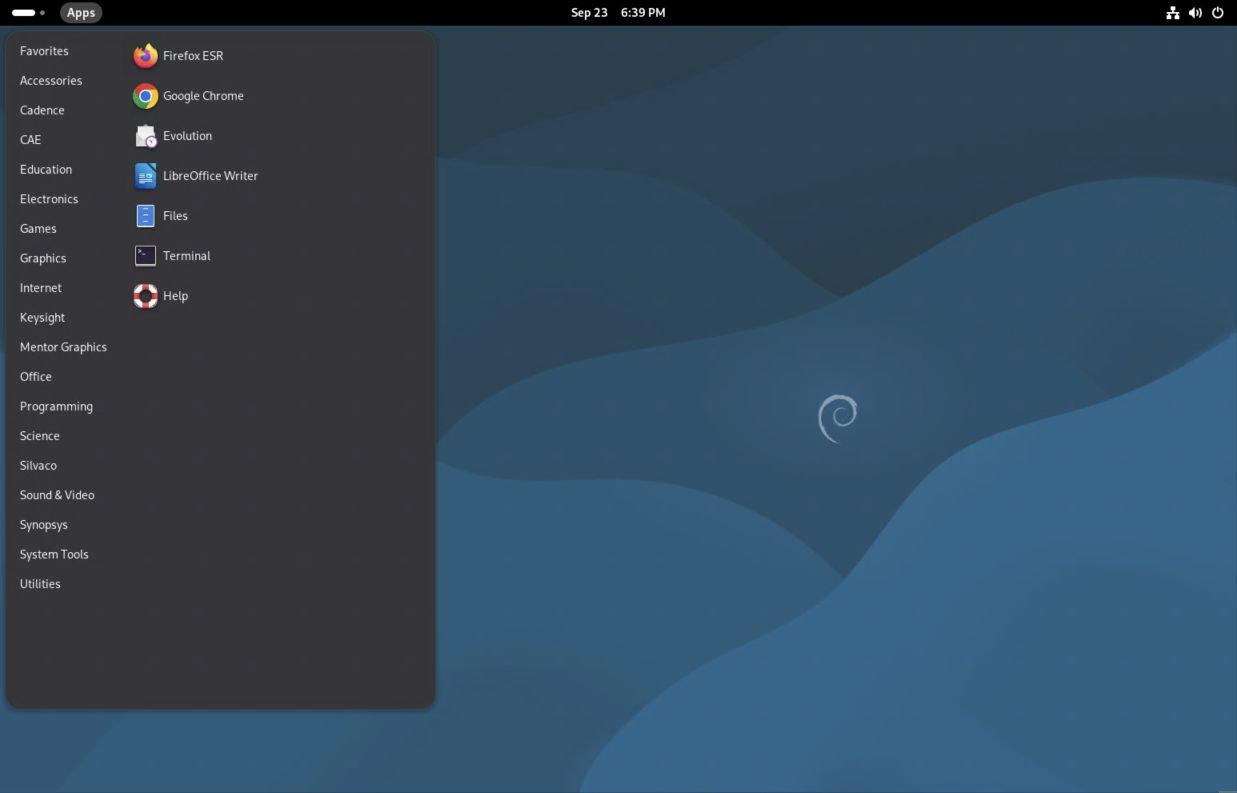
- Wait for the Linux desktop. Open Apps in the upper-left corner and choose Terminal under Favorites. Maximize the terminal by double-clicking its title bar.
- Keep the Guacamole tab open. A terminal inside this desktop is already on CAE; do not SSH back into CAE from it.
If you already have an active session, the browser may reconnect without showing every login screen. If sign-in fails, record which prompt failed: UW web sign-in, MFA, or the Linux desktop login. These are different stages.
More help with Guacamole sign-in, including CAE's official instructions and screenshots: https://kb.wisc.edu/cae/163323
Enter the Synopsys environment
Run these commands in the CAE terminal, one line at a time. Do not type a prompt such as $ or synopsys> before a command.
module load synopsys/suite
synopsys-run
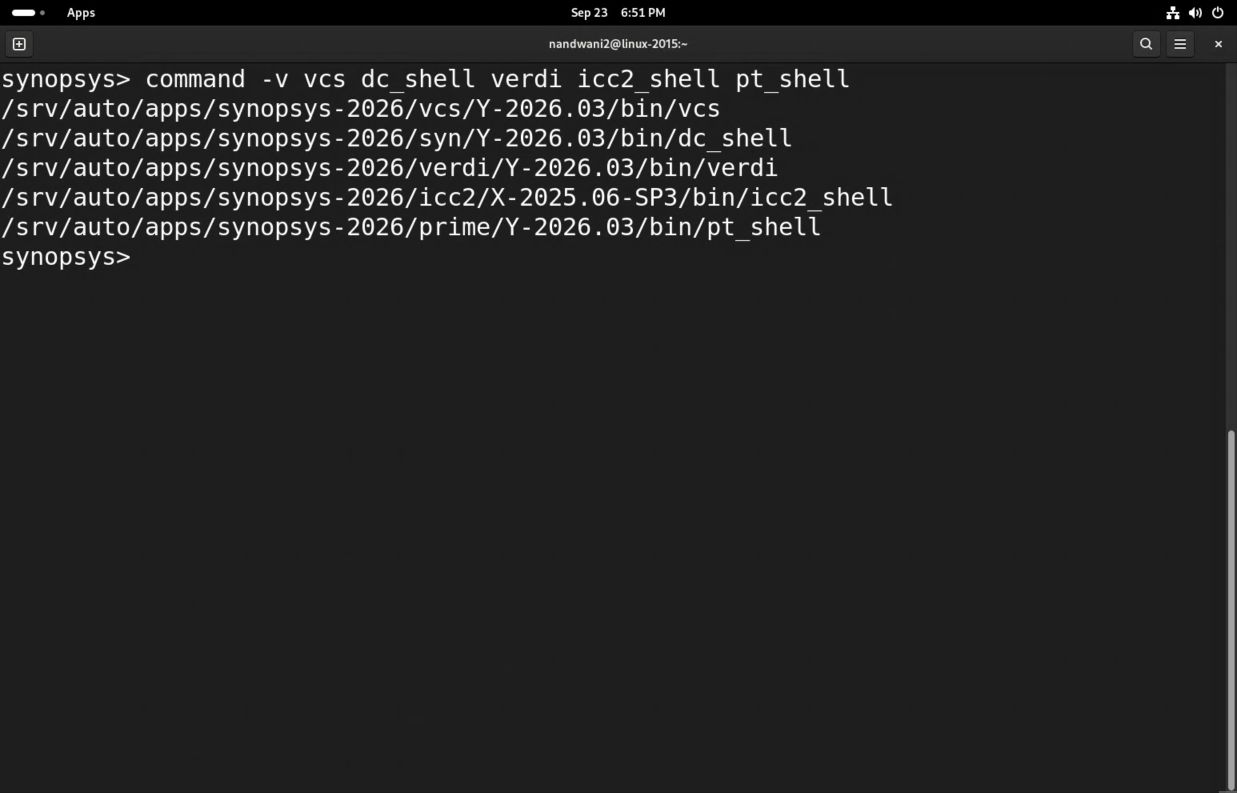
command -v vcs dc_shell verdi icc2_shell pt_shell
The prompt becomes synopsys>. The module selects the site setup; the container provides the operating environment expected by the tools. Load the module before entering the container and repeat this setup for every new terminal used for Synopsys tools.
Companion code
RTL: https://github.com/abhinavnandwani/cae-synopsys-guides/blob/main/lab/rtl/sb_flop.v
Testbench: https://github.com/abhinavnandwani/cae-synopsys-guides/blob/main/lab/tb/tb.sv
Runner: https://github.com/abhinavnandwani/cae-synopsys-guides/blob/main/lab/run_lab.py
Synthesis script: https://github.com/abhinavnandwani/cae-synopsys-guides/blob/main/lab/synth/run.tcl
Commands below use ~/cae-synopsys-guides/lab as the exercise directory. The recorded screenshots show the original dated demonstration folder.
Work confidently in the terminal
The current directory affects relative paths. pwd prints it, ls lists files, cd .. moves to the parent, and cd ~/cae-synopsys-guides/lab returns to the exercise. A leading / means an absolute path; ~ means your home directory. Quote paths containing spaces.
| Prompt or location | Commands that belong there |
|---|---|
| Laptop Terminal or PowerShell | ssh to reach the CAE host shell. |
| CAE host shell | module load synopsys/suite, then synopsys-run. |
Container synopsys> | Linux commands, python3 run_lab.py, vcs, verdi, dc_shell, and icc2_shell. |
Tool prompt such as dc_shell> | Tool Tcl commands such as read_ddc, report_timing, and help. |
Use these from the exercise folder to inspect source and logs without changing them:
ls -lh
cat rtl/sb_flop.v
sed -n '1,80p' tb/tb.sv
less runs/YOUR_RUN/compile.log
grep -nE 'Error|Fatal|Warning' runs/YOUR_RUN/compile.log
tail -n 30 runs/YOUR_RUN/simulate.log
Replace YOUR_RUN with an actual directory printed by the runner. In less, use Space to advance, /Error then Enter to search, n for the next match, and q to return to the shell. An Up-arrow recalls a command; Tab completes a path. Read a command before rerunning it.
For an interactive foreground command that is stuck, Ctrl+C requests interruption. For a GUI launched with &, close the application through its File menu. jobs lists jobs started by that shell. Keep logs: command > run.log 2>&1 sends both standard output and errors to a file. Immediately after a command, echo $? reports its exit status, but a zero status alone does not prove the design passed.
Connect without the browser when useful
For terminal-only work, open a terminal on your laptop and run ssh YOUR_NETID@best-tux.cae.wisc.edu, then load the module and enter the container as above. Use Guacamole for the GUI steps in this handout. SSH and Guacamole may reach different hosts, but your CAE home directory is shared.
When finished, save work, close the EDA applications, and run exit to leave the container. Log out of the Linux desktop from the upper-right system menu. Closing the browser alone can leave the session running during CAE's two-hour reconnection window.
Read the RTL as a hardware contract
From the exercise directory, inspect both the design and the test that drives it:
cat rtl/sb_flop.v
sed -n '1,100p' tb/tb.sv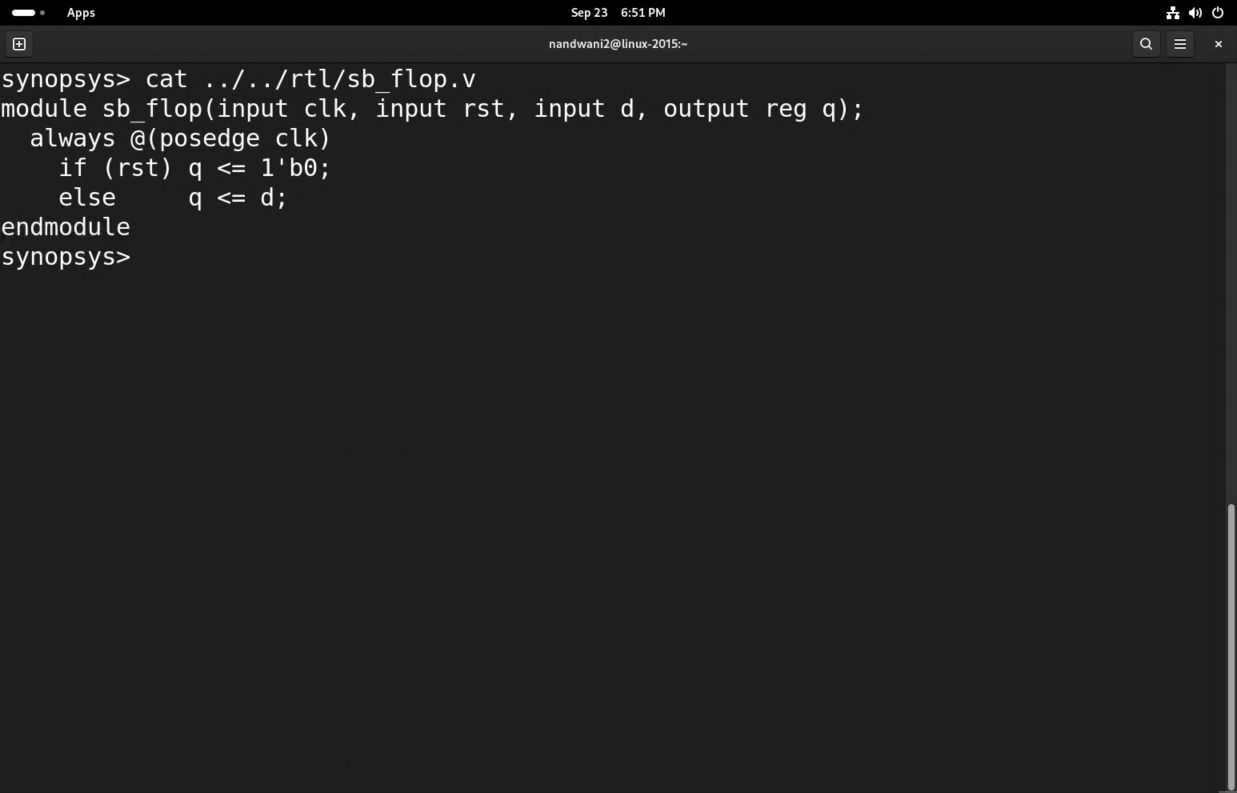
The top module is sb_flop. Its inputs are clk, rst, and d; its output is q. The always block runs on a rising clock edge. Reset is active high and synchronous: asserting it between edges does not immediately update q. The nonblocking assignment schedules the register update for that simulation time step.
Read the testbench next. tb instantiates the design as dut, generates the clock, and checks values after clock edges. The design top and the simulation top are different: synthesis uses sb_flop, while VCS uses tb for this test. Selecting the wrong top can produce an apparently successful build that never applies your stimulus.
Organize source changes before building
Keep synthesizable design source in rtl/, testbench code in tb/, and tool scripts in their own directories. Generated netlists, databases, logs, and waveforms belong in run directories. Edit the design source, then rebuild; editing mapped.v does not fix the RTL that generated it.
Compile and simulate from the terminal
Use the verified runner for the first iteration:
cd ~/cae-synopsys-guides/lab
python3 run_lab.py simulation
Find the printed RUN_DIRECTORY. Inspect compile.log first, then simulate.log. Confirm the SB_SNPS_SIM_PASS marker and the expected run verdict. The runner also verifies that the deliberate fault is caught. It does not interpret raw exit zero as sufficient evidence of success.
For a larger block, keep a source manifest that lists the exact package, include, RTL, and testbench files. Package definitions must be available before code that imports them. Keep parameter overrides and the selected top in the build command or script, not in someone's terminal history.
The core compile and run pattern for this example is:
vcs -full64 -sverilog -timescale=1ns/1ps \
  -ntb_opts uvm-1.2 -debug_access+all -kdb \
  -cm line+cond+tgl+branch+assert \
  /absolute/path/to/rtl/sb_flop.v \
  /absolute/path/to/tb/tb.sv -top tb -o simv
./simv -cm line+cond+tgl+branch+assert
Run manual builds in a fresh run directory, with VERDI_HOME set as in run_lab.py. Replace the example absolute paths. The runner already does this setup, saves logs, and enforces a timeout. The direct commands show what it is doing and what must change for your block.
Diagnose the first failure
| Symptom | First inspection |
|---|---|
| Missing module or package | Check the file manifest, include paths, package order, and selected top. |
| Width or signedness warning | Compare the source declaration with the interface contract and expression widths. |
| Unknown output | Check reset, initialization, driving logic, and whether the output has been sampled after an active edge. |
| Correct compile but wrong test result | Inspect stimulus, reset polarity, cycle timing, and the checker in the waveform. |
| GUI shows old source | Rebuild and open the waveform and debug data from the same new run directory. |
Treat warnings as questions to resolve. A successful compile does not establish protocol behavior, numeric accuracy, clock-domain safety, or complete test coverage.
Trace source and behavior in Verdi
Change into the passing simulation directory and launch:
verdi -ssf smoke.fsdb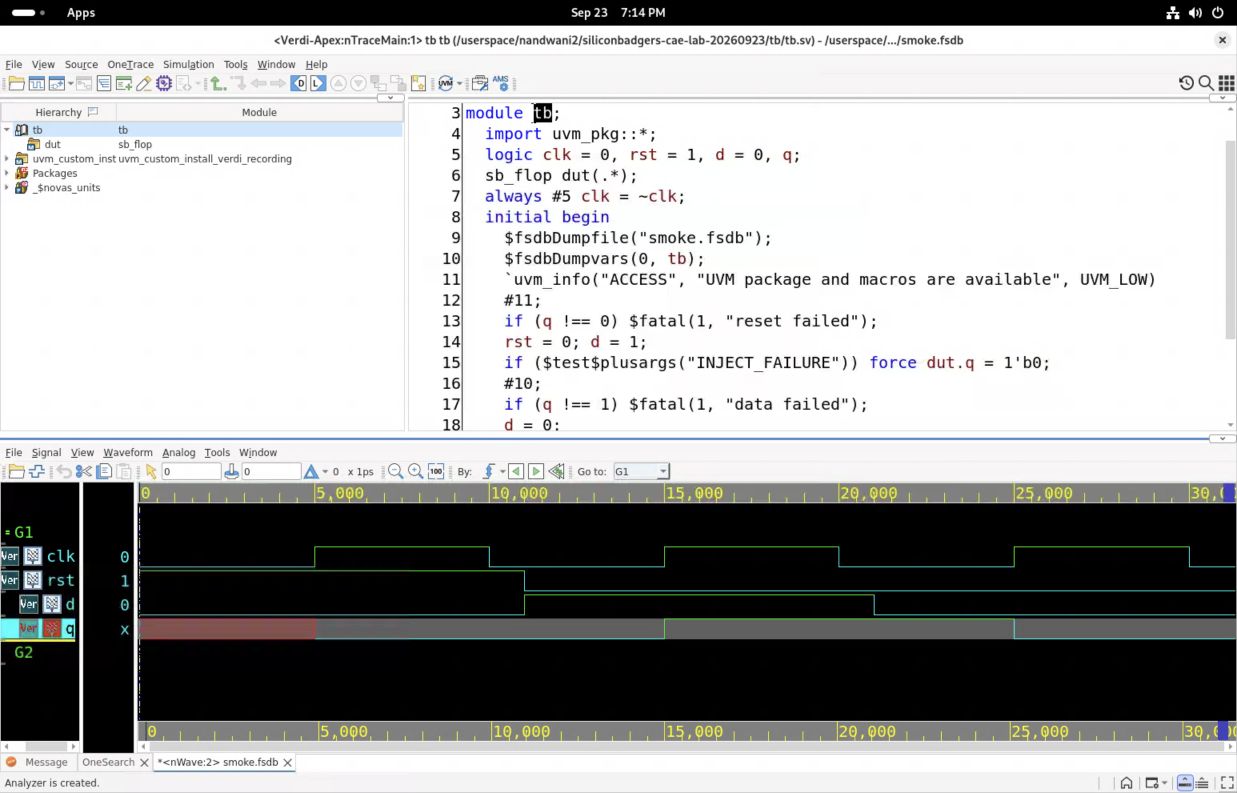
- Maximize the window. In the hierarchy, select
tb, then expand it and selectdut. Confirm that the source pane showssb_flop. - Identify the edge-sensitive block and reset condition. Return to
tband identify when the stimulus changes relative to the clock. - In nWave, open Signal, Get Signals. Select
/tb, addclk,rst,d, andqwith Apply, then click OK. - Choose nWave View, Zoom, Zoom All. Place the cursor near a rising edge and compare all four signals at the same time.
- Follow reset through the first edge at 5 ns. Then inspect the input change at 11 ns and output change at 15 ns. Explain the delay in terms of the source, not just the shape of the waveform.
- Inspect the 21 ns and 25 ns transitions. If an output differs from the test expectation, find the first differing time and work backward through its inputs and driving statement.
Do not infer reset behavior from a signal name alone. This example uses synchronous reset. Your block's reset polarity, synchronization, and release requirements must come from its interface contract. Use the appropriate stimulus and sampling convention when you adapt the test.
If signals are missing, confirm the selected scope and dump coverage. If a value column looks surprising, check the cursor time. A value at the initial cursor is not the final value in the simulation.
Run a synthesis sanity check
From the exercise root, run:
python3 run_lab.py synthesisThe runner selects the teaching timing library, sets the source path, and calls Design Compiler with synth/run.tcl. It checks the log, completion marker, and generated outputs. Inspect the new run's synthesis.log, mapped.v, area.rpt, timing.rpt, and constraints.sdc.
The script reads RTL, selects sb_flop, links references, defines the clock and I/O timing, compiles, checks the design, and exports a mapped database and netlist. The 10 ns clock and 1 ns interface delays are teaching assumptions. Your real block needs constraints agreed with its surrounding interfaces.
Open the mapped design in Design Vision
In Guacamole, change into the printed synthesis run directory and run design_vision. Allow startup to complete, then maximize the window. The bottom input line is a Tcl command prompt, not a Linux shell. Enter the following there, one command at a time:
set edk /srv/auto/apps/saed32_edk/2023/lib/stdcell_rvt
set dbdir "$edk/SAED32_EDK/lib/stdcell_rvt/db_nldm"
set lib "$dbdir/saed32rvt_tt1p05v25c.db"
set_app_var target_library [list $lib]
set_app_var link_library [concat * $target_library]
read_ddc mapped.ddc
current_design sb_flop
link
read_sdc constraints.sdc
check_design
Inspect the console after every command. The expected current design is sb_flop, and references must resolve. If a library cannot be found, check the path and environment before interpreting the schematic. Loading a DDC and seeing a top module are not sufficient if linking still fails.
The DDC is a tool database for resuming inspection. Keep RTL, scripts, and constraints as the maintained inputs. Preserve the tool version with any saved database.
Inspect the schematic in the GUI
Select sb_flop in Logical Hierarchy. Choose Schematic, then New Schematic View. The first view is the module boundary with its ports. Double-click the module box to expand the mapped contents.
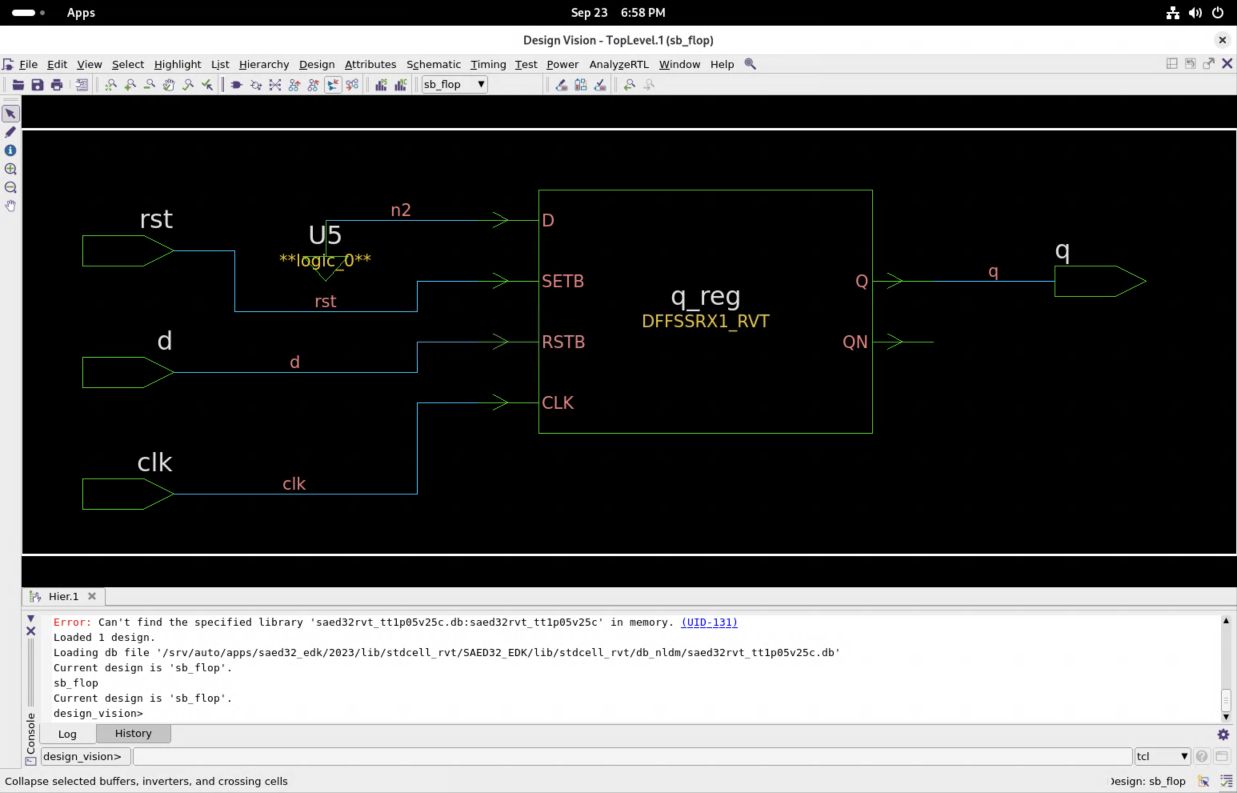
- Find
clk,rst,d, andqat the boundary. Confirm the intended directions and compare them with the RTL declaration. - Find the mapped sequential instance
q_reg. Trace its output toqand inspect how reset and data connect through the mapped implementation. Use actual pin names and library semantics when interpreting the cell. - Choose View, Zoom, Zoom Fit All to recover the complete view. Zoom into a cell or net when reading labels. The small pane control at the upper right can collapse a pane; double-click its bottom tab to restore it.
- Select a cell or net to distinguish it from surrounding logic. Use the Schematic menu's fanin and fanout commands when following a larger design. Keep the selected object and direction of tracing explicit.
- Compare the schematic with
mapped.vandarea.rpt. Synthesis may implement the RTL using library-specific cells, constants, or transformations. A familiar-looking drawing is not an equivalence proof.
For larger blocks, inspect register boundaries, muxing, arithmetic widths, and unexpected constant or disconnected signals. An unexpectedly small design can mean intended logic was optimized away because outputs were unused or constraints and connectivity were wrong.
For readability, Design Vision exposes font controls under View, Preferences, Style Settings. Change Normal for labels and Monospace for report text. Prefer enlarging the relevant pane and text before taking a screenshot. Keep the saved source and reports with the image so you can trace it back to the run.
Connect a timing report to the source
In Design Vision, choose Timing, then Report Timing Path. Start with Delay type max, Path type full, one worst path per endpoint, and one path per group. Leave From, Through, and To empty for an initial overall report and select To report viewer. Click OK.
Read the startpoint, endpoint, clock, path group, arrival time, required time, and slack. Use the report's object links and the schematic to locate the relevant cell or net. For a focused investigation, return to the dialog and select the intended startpoint or endpoint. Confirm whether the report is analyzing maximum delay or minimum delay before drawing a conclusion.
The same inspection is available in the tool console:
report_timing -delay_type max -max_paths 5
report_timing -delay_type min -max_paths 5
report_constraint -all_violators
report_area
Positive slack on one reported path does not prove that every path is constrained or that physical timing will pass.
Close Verdi and Design Vision when finished, then leave the container and log out of the CAE desktop.
Setup reference: https://kb.wisc.edu/cae-software-guide
Debug reference: https://www.synopsys.com/verification/debug/verdi.html